We are all exposed to a degree of air pollution originating from various sources, with traffic being one of the most dominant sources. However, in the case of traffic-related air pollution, it is interesting to analyse whether the people who are the generators of this pollution are also exposed to higher degrees of traffic-air pollution. The results of the analysis are clear: in areas where people on average own fewer cars (and in effect drive less and generate less pollution), those people are on average exposed to higher levels of traffic-related air pollution. This is a textbook example of environmental injustice.
What do we observe?
NO2 is used as a proxy for traffic-related air pollution. As seen in Figure 1, the average car ownership per household at the statistical sector level is higher for statistical sectors with mean NO2 values below 20 µg/m³ compared to the car ownership per household in areas at higher air pollution concentrations of 25–50 µg/m³.
When we make a divide between urban and rural areas (not shown), we observe that car ownership is more or less constant in rural and intermediate areas, with on average between 1.2–1.3 cars owned per household. In urban areas, car ownership varies from 0.25–1.25 cars owned per household.
As seen in Figure 2, as the fraction of the area covered by primary and secondary roads per statistical sector increases, NO2 values increase as well. This is as expected: where there are busier roads (i.e. primary and secondary ones), it is to be expected that there are higher traffic-related air pollution values.
Figure 3 shows the absolute number of cars per statistical sector in relation to the NO2 values. More cars are expected in the more densely populated areas, and higher as NO2 values are expected here. However, as we see on the figure, the relation between the absolute number of cars and increase in as NO2 values is sub-linear indicating that also this indicator alone is insufficient to come to a complete explanation of the observed phenomena.
In Figure 4, which displays a proxy for deprivation related to education on the y-axis (1 = most deprived, 10 = least deprived), it can be seen that the deprivation related to education decreases as NO2 values increase. However, from a certain threshold of around 20 µg/m³, there is a considerable positive trend between deprivation related to education and increasing NO2 values, with the most deprived statistical sectors in terms of education (i.e. low decile values of 2–3) concurrent with very elevated NO2 values of 40 µg/m³ and higher. In Figure 5, we notice a similar pattern for income.
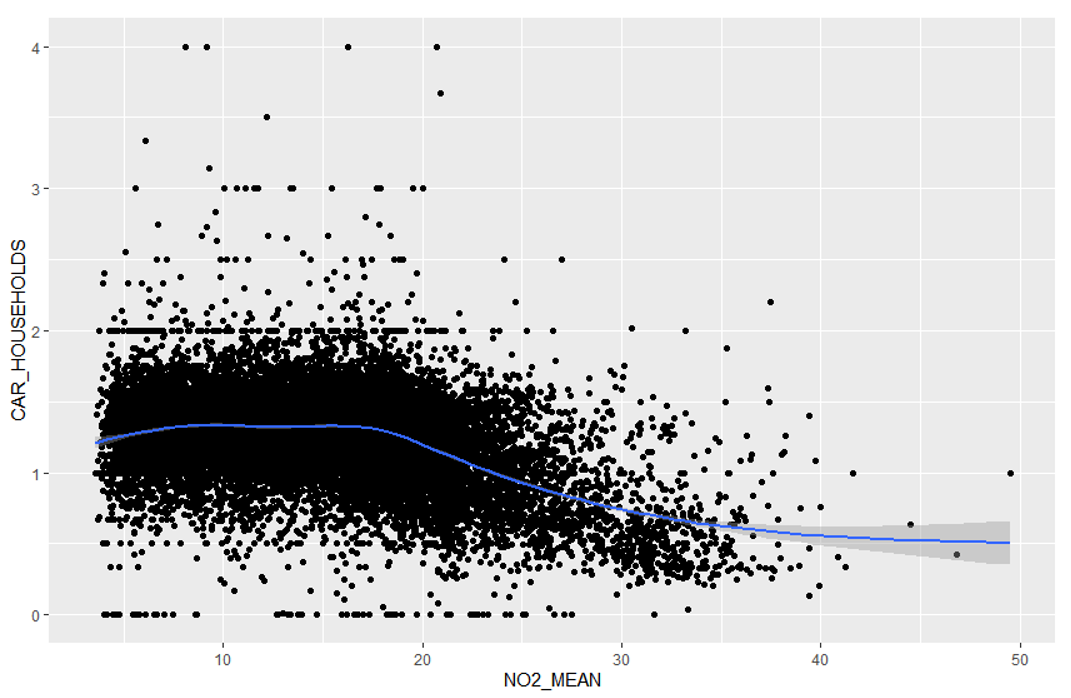
Figure 1: Relationships between the average number of cars owned per household and the mean NO2 value per statistical sector. The blue line indicates the trend line based on several local regressions.
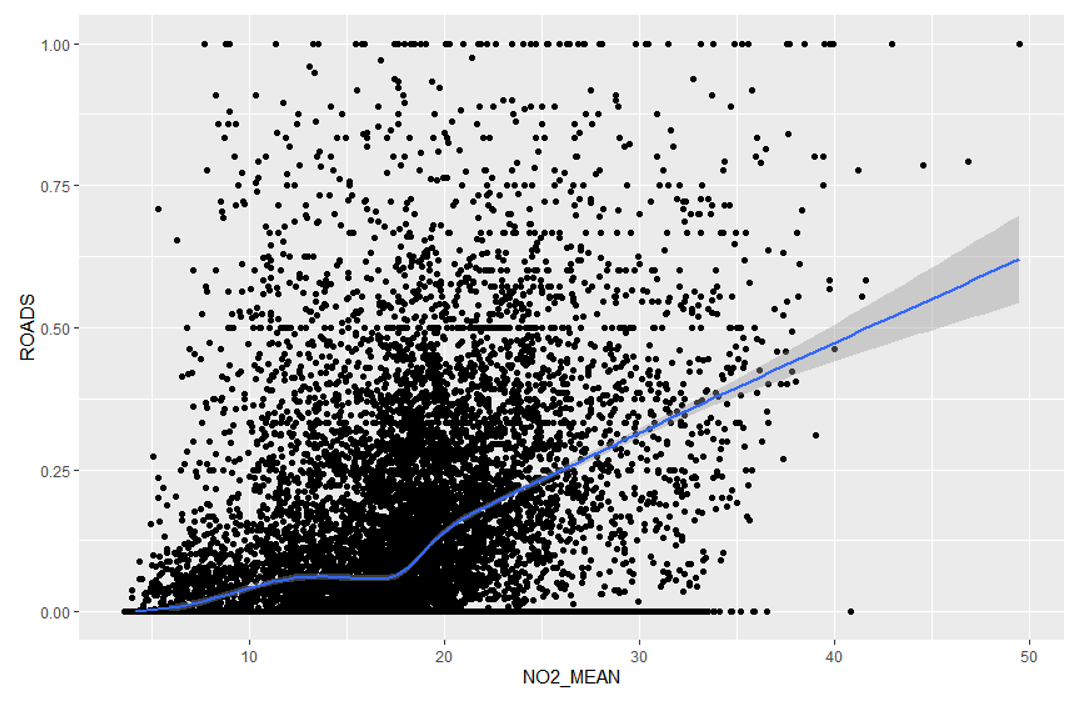
Figure 2: Relationship between the mean NO2 value per statistical sector and the fraction of primary and secondary roads (high-traffic roads) per statistical sector.
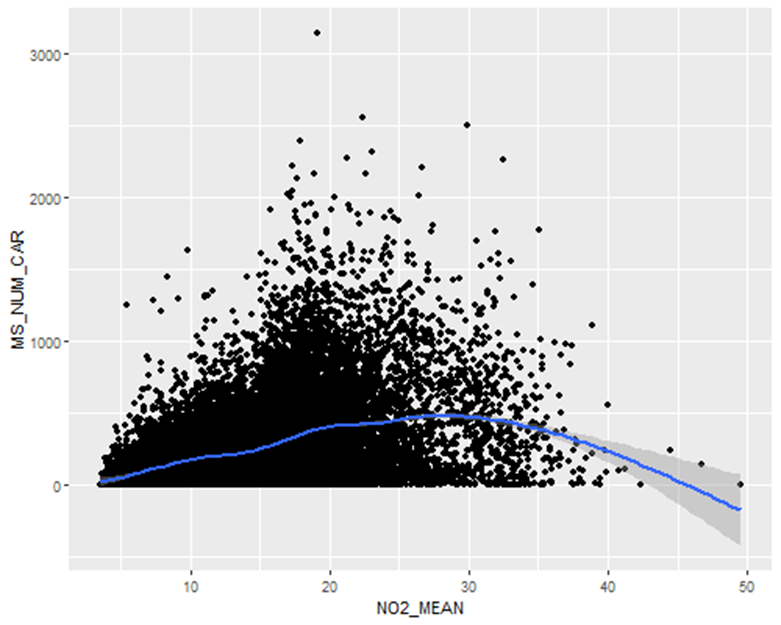
Figure 3: Absolute number of cars per statistical sector plotted against the mean NO2
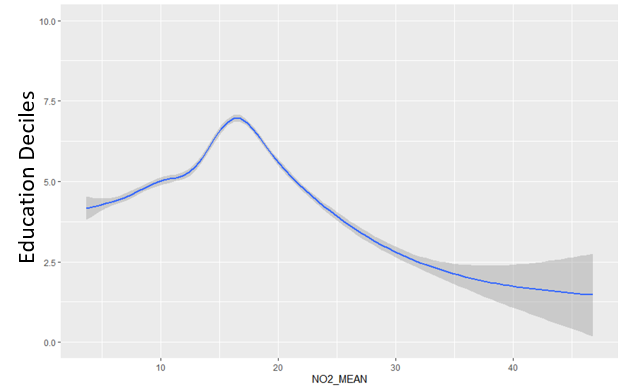
Figure 4: Relation between the mean NO2 value per statistical sector and deciles of an index of deprivation related to the education domain per statistical sector (10= least deprived and 1= most deprived).
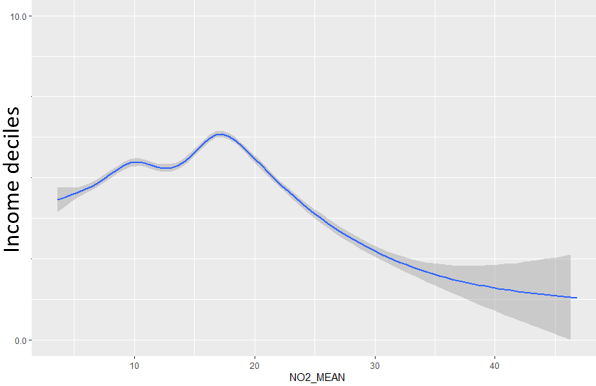
Figure 5: Relation between the mean NO2 value per statistical sector and deciles of an index of deprivation related to the income domain per statistical sector (10= least deprived and 1= most deprived).
What are the implications of our findings?
Our findings are a textbook example of environmental injustice: the areas that contribute the most to the generation of emissions per capita are not the same areas that are exposed to the highest levels of traffic-related air pollution. In this case, there are various explanations for this observation: car ownership is higher in rural and intermediate areas and lower in urban areas; in urban areas, there is a high concentration of people, which counteracts with the fact that on average, people own fewer cars in urban areas. In addition, people living in other areas with high car ownership contribute to emissions in the most polluted areas by driving their cars through cities, making use of the available roads.
We also analysed this phenomenon when we made a divide between urban and rural areas. We observed that this pattern occurs within urban areas: car ownership is lower than in the most polluted urban areas. There may be dual reasons for this: on the one hand, the highest NO2 concentrations occur where the population concentration is the highest, as more households living in an area counteracts the reduced car ownership per household. And, on the other hand, people living in cleaner parts of the cities contribute to the emissions experienced by people living in the most polluted parts of cities.
In Figure 6, we see that car ownership is especially low in urban centres, with < 0.75 cars owned per household in urban centres of cities like Leuven, Brussels, Antwerp and Mechelen. However, in the suburban surroundings, car ownership per household is considerably higher. As we see in Figure 7, in large cities like Antwerp and Brussels, the traffic-related air pollution concentrations (for which we use NO2 here as a proxy) are in general higher in the urban city centres compared to in the suburban surroundings. As mentioned, this is in part logical, as the population density is higher in those urban city centres; an average lower car ownership per household can still result in a larger number of absolute cars, given the population density. However this is only a partial explanation and not a complete one, as we also noticed that the relation between the absolute number of cars and increase in as NO2 values is sub-linear, indicating that people living in cleaner areas contribute to the emissions experienced by people living in the most polluted parts of cities may be another part of the equation. Nevertheless, it remains the case that in the statistical sectors with elevated traffic-related air pollution exposure, car ownership is on average lower, so the higher traffic-related air pollution levels can be considered environmental injustice:
- Health implications: This phenomenon has health implications: people in urban city centres who on average own fewer cars experience more severe health problems from traffic-related air pollution despite contributing less to this pollution and those negative health outcomes per capita. Health outcomes associated with traffic-related air pollution include cardiovascular and respiratory diseases.
- Societal costs of living: Living in rural and suburban areas costs more for society and taxpayers compared to living in urban centres (figure 8). This implies that there is less taxpayer money per capita spent on the needs of those living in urban areas. There is already a lower per capita car ownership in those areas, but in order to address the above discussed environmental inequality, more efforts are needed to mitigate this inequality such as more investments in public transport and active transport in order to reduce traffic-related air pollution in those areas. Parking outside city centres, where visitors of those cities can switch to public transport and so do not need to drive through the cities, can also help. To read more about the societal cost of living, you can consult [3] or [4], articles in dutch which provide more information on the topic.
- Socio-economic deprivation: To make the inequality even worse, we see that in areas with high NO2 concentrations, there is considerably more deprivation related to educational factors and income on average. This implies that the people in city centres, who contribute less to traffic-related air pollution generation per capita compared to people in other areas, are both exposed to elevated traffic-related air pollution concentrations and are on average more deprived in socio-economic terms. This can also have severe implications for their health: air pollution and socio-economic inequalities themselves can trigger harmful health effects, but the combination of both can be a synergistic catalyst for harmful health effects whereby the sum of the health effects is larger than the sum of the individual components of the health effects [1].
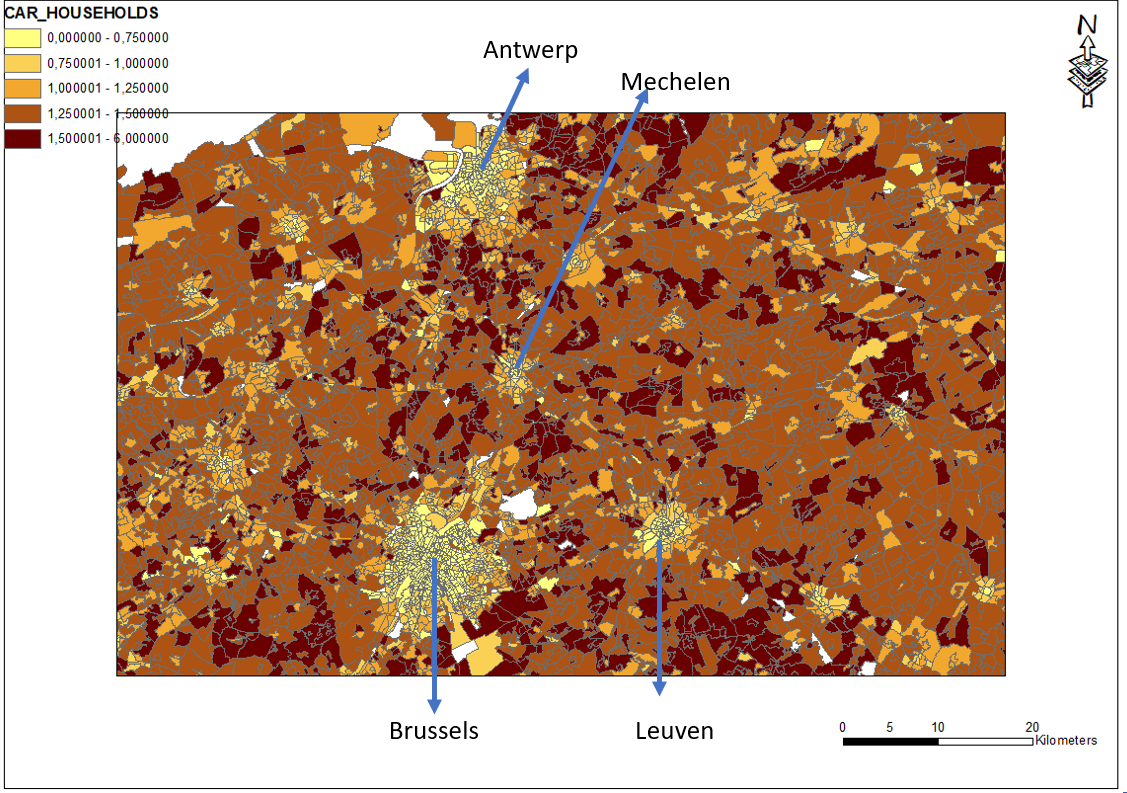
Figure 6: Average car ownership per household in the statistical sectors. Map created based on source data from Statbel.
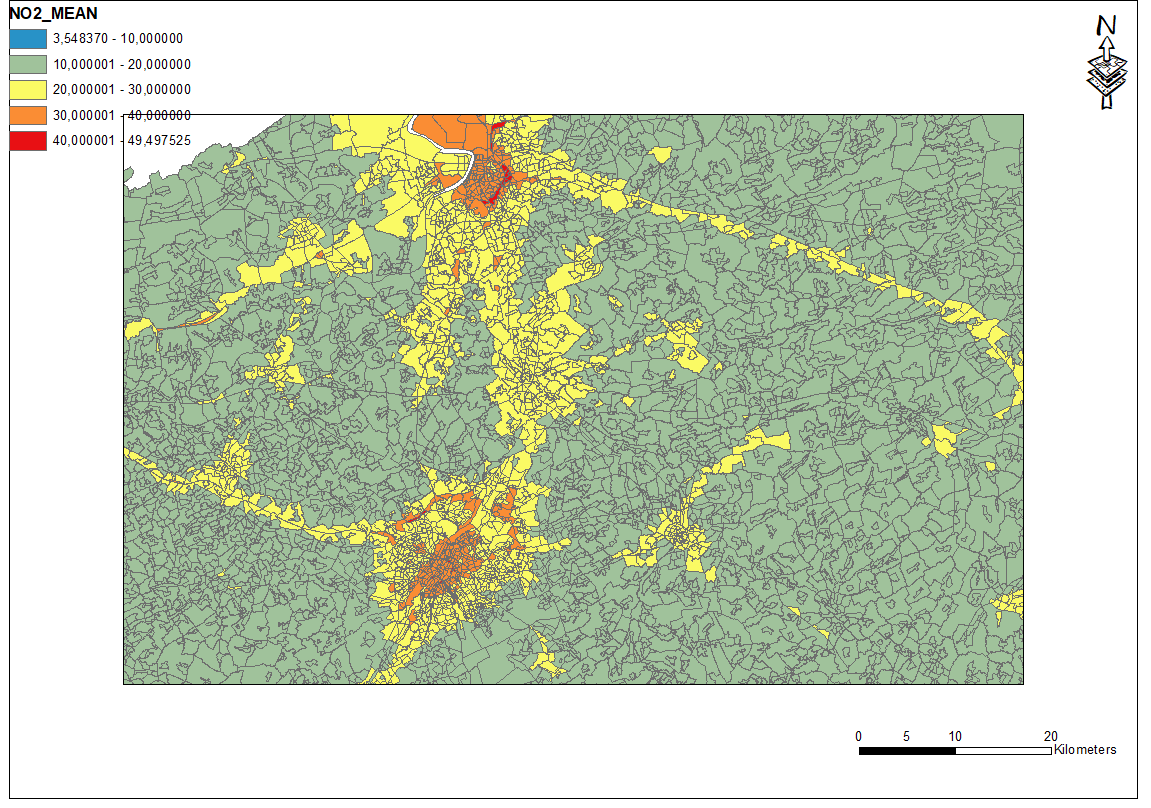
Figure 7: Mean NO2 concentrations per statistical sector in the selected area. Map created based on source-data from irceline, https://irceline.be/en
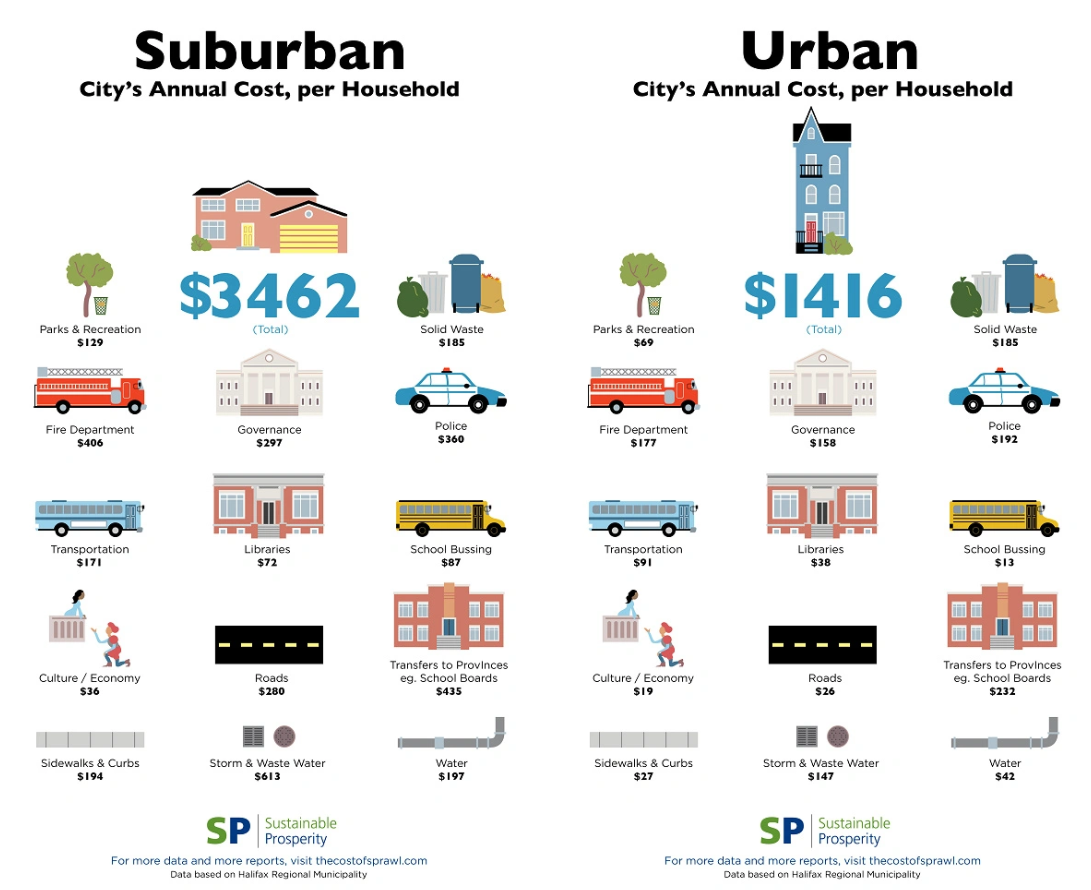
Figure 8: Societal cost of living in urban and suburban areas. Source: [2].
References
- https://www.ahajournals.org/doi/10.1161/str.46.suppl_1.153
- https://usa.streetsblog.org/2015/03/05/sprawl-costs-the-public-more-than-twice-as-much-as-compact-development
- https://www.gemeentevoordetoekomst.be/artikel/hoeveel-kost-de-ruimtelijke-wanorde
- https://www.vrt.be/vrtnws/nl/2019/03/28/strenge-en-onmiddellijke-betonstop-zou-vlaanderen-tot-1-7-miljar/