
Sparse housing conditions are associated with poor health and increased mortality in Belgium. Between 1991 and 2019, inequalities in mortality associated with housing conditions persisted, but decreased in magnitude. In addition to being a reflection of socio-economic status, housing can carry physical, psychological and social risk for impaired well-being. Social policies ensuring good housing conditions are therefore a crucial prerequiste to reduce health inequalities.
The development and application of the housing deprivation index is a prelude to the development of the Belgian index of multiple deprivation, which will provide an even more comprehensive view of area-level deprivation in Belgium.
What is the Housing Deprivation Index?
We started our work on the Belgian Index of Multiple Deprivation (BIMD) by building the housing deprivation domain. Selection of its indicators was based on the literature review, previous research (specifically by Thierry Eggerickx from UCLouvain), and on the premises that the indicators must be the best possible measure of housing deprivation in Belgium for the given time period. Chosen indicators vary across the years but they always represent only the proportion of population who is deprived, not affluent. For instance, we included the proportion of individuals in a statistical sector who does not have a central heating, bathroom, or internet connection. Our methodology was straightforward, we used maximum likelihood factor analysis (FA) to combine the indicators on the level of statistical sector, then we ranked these statistical sectors from the least to the most deprived, based on the FA score. In the final step, we assigned deciles in a way that the most deprived statistical sectors were in the first decile.
How did we analyze our data?
We utilized individual-level mortality data at ages 0-100+ from the National Register in Belgium between Jan 1, 1991 and Dec 31, 2019. Data included the decedent’s date of death, sex, and a personal identification number that allowed us to identify decedent’s statistical sector at the time of death.
Mortality and population data were stratified according to 5-year age group, sex, deprivation decile and two 10-year periods (1991-2000, 2001-2010) and one 9-year period (2011-2019). To identify the deprivation across sectors, we applied the housing deprivation indices 1991 and 2001 to the time periods 1991-2000 and 2001-2010, and the housing index 2011 to the 2011-2019 period.
First, we computed age-standardized mortality rates (ASMR) per 100,000 person-years by decile, sex, and time period using the sex and age structure of the Belgian population structure in 2018.
Within each age group, sex, and period, the mortality rate for the least deprived decile was used as a reference group and applied to the other deciles to produce a number of expected deaths. The mortality attributable to housing deprivation inequality was calculated as the difference between the observed and expected deaths, expressed as a population attributable fraction (PAF).
Lastly, we computed the years of life lost (YLLs) to inequality as the difference between the years lost due to death before age 75 years in each of the cohort and the corresponding least deprived cohort. As in the previous health indicator, we standardized our results by using the Belgian population structure in 2018.
What did the results show?
Our study covered 310 million person-years in people aged from 0 to 100+, with 3,039,338 deaths. During the study period mortality rates decreased in all deprivation groups for both sexes. Reductions in absolute mortality rates were greater for the most deprived groups in men and women (434 and 280 per 100,000 person-years), while the reduction in absolute mortality rates were similar for most and least deprived groups (about 26% in men and 20% in women).
If Belgium had the same risk of mortality as the least deprived group, 469,667 fewer deaths would have occurred between 1991 and 2019. The proportion of mortality attributable to housing inequality varies by sex and time period. In males, an increase in the PAF from 20% to 26% was followed by its decrease to 12% in the periods 1991-2000, 2001-2010, and 2011-2019, respectively.
Our results also suggested that premature mortality caused a mean of 5.7, 4.6, and 4.1 years lost before age 75 years per person in 1991-2000, 2001-2010, and 2011-2019. If everyone in Belgium had the mortality risk of the least deprived group, these values would have been reduced to a mean of 4.5, 3.2, and 3.7 YLLs. We calculated that 21.4%, 29.7% and 10.7% of years of life lost due to premature mortality could be attributed to inequality.
Table 1. Trends in mortality inequalities according to housing deprivation index.
| 1991-2000 | 2001-2010 | 2011-2019 | Change (%) | ||
|---|---|---|---|---|---|
| Male | |||||
| Most deprived | 1654 | 1495 | 1220 | -26.3% | |
| Least deprived | 1202 | 923 | 894 | -26.4% | |
| Difference | 452 | 572 | 326 | -28.2% | |
| PAF | 20.4% | 26.3% | 11.8% | -47.1% | |
| Female | |||||
| Most deprived | 1406 | 1271 | 1126 | -20.2% | |
| Least deprived | 1163 | 1027 | 912 | -22.4% | |
| Difference | 243 | 244 | 214 | -12.1% | |
| PAF | 12.1% | 12.6% | 10.5% | -17.3% |
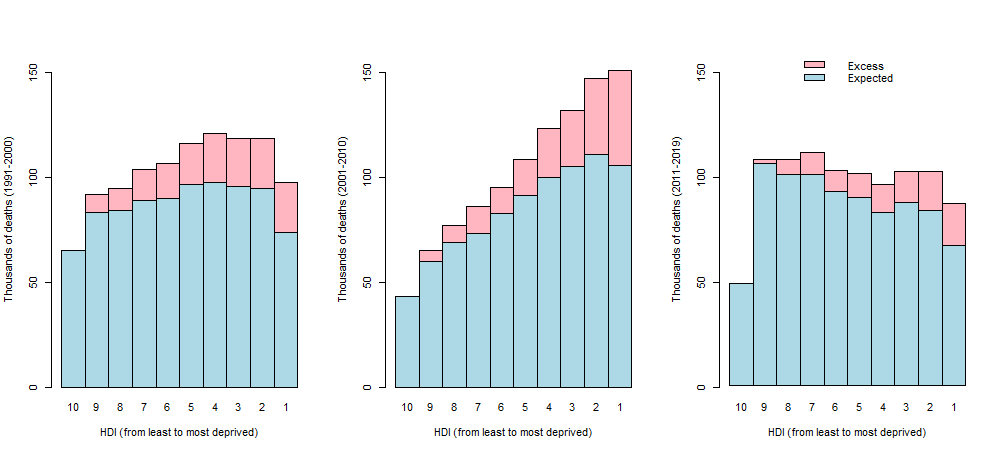
Figure 1. Expected and excess mortality by housing deprivation index (HDI) and time window.
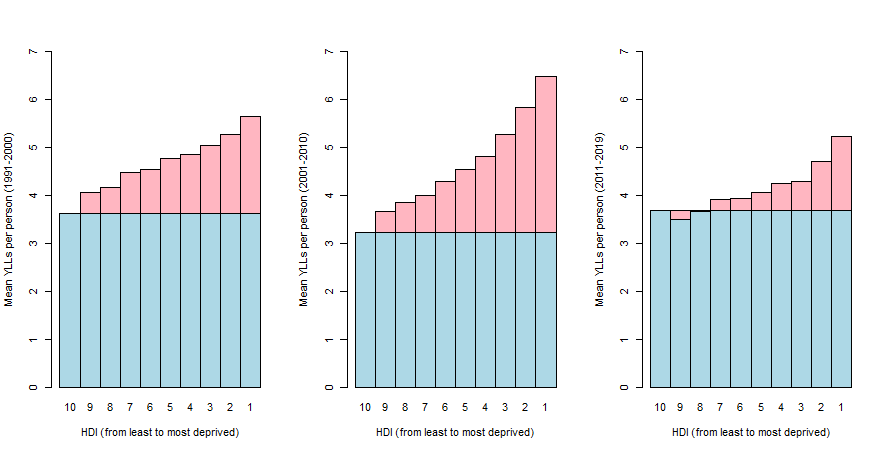
Figure 2. Expected and excess years of life lost by housing deprivation index (HDI) and time window.
What can we conclude?
We have shown that housing conditions play an important role in mortality inequalities and ensuring good housing conditions can help in reducing avoidable mortality. We found large differences in mortality that might be associated with socioeconomic inequality, here defined as housing inequality. We can assume that a large proportion of premature deaths could be avoided, as well as a reduction in years of life lost could be achieved by eliminating housing inequalities. Therefore, ensuring good housing conditions seems a necessary step to reduce inequalities and its improvement should be considered in new social policies.